Richest Cities in Massachusetts (2026)
by Kristen Carney
Updated: February 9, 2026
Richest City in Massachusetts
The richest city in Massachusetts is Weston with an average household income of $411,085 as of 2024 and 11,579 people as of 2024 according to the most current Census data available (citation).
| Rank | City | County | Population | Average Income | Median Income |
|---|---|---|---|---|---|
| 1 | Weston | Middlesex | 11,579 | $411,085 | $250,001 |
| 2 | Dover | Norfolk | 5,930 | $407,763 | $250,001 |
| 3 | Wellesley | Norfolk | 30,347 | $367,512 | $250,001 |
| 4 | Carlisle | Middlesex | 5,239 | $333,401 | $250,001 |
| 5 | Sherborn | Middlesex | 4,427 | $320,991 | $250,001 |
| 6 | Lexington | Middlesex | 34,295 | $311,976 | $238,444 |
| 7 | Winchester | Middlesex | 23,406 | $308,771 | $230,198 |
| 8 | Cohasset | Norfolk | 8,427 | $307,351 | $199,306 |
| 9 | Medfield | Norfolk | 13,068 | $300,167 | $235,800 |
| 10 | Sudbury | Middlesex | 19,306 | $289,498 | $236,250 |
| 11 | Hopkinton | Middlesex | 19,358 | $285,962 | $222,801 |
| 12 | Wayland | Middlesex | 13,914 | $285,140 | $224,000 |
| 13 | Needham | Norfolk | 32,459 | $284,640 | $214,308 |
| 14 | Concord | Middlesex | 18,223 | $281,851 | $195,350 |
| 15 | Edgartown | Dukes | 5,278 | $281,025 | $125,236 |
| 16 | Westwood | Norfolk | 16,318 | $276,374 | $223,125 |
| 17 | Lincoln | Middlesex | 6,948 | $269,779 | $175,117 |
| 18 | Manchester-by-the-Sea | Essex | 5,403 | $268,125 | $206,389 |
| 19 | Harvard | Worcester | 6,927 | $267,608 | $213,996 |
| 20 | Boxford | Essex | 8,208 | $266,436 | $200,871 |
Median Income versus Average Income: Which Should You Use?
We usually suggest using median income data – either instead of or in addition to – average income data as a true indicator of wealth. If you haven’t thought about median versus average since your last standardized test, you aren’t alone. Here’s what they are:
- average is the sum of a set of numbers divided by the count of numbers in the set
- median is the middle number in the set of numbers
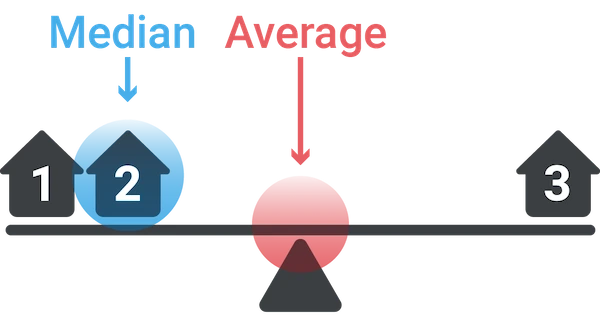
Now let’s say you had the following simplified set of income data.
Household 1: $30,000
Household 2: $50,000
Household 3: $1,000,000
The average income for this set is $360,000. The outlier data point ($1,000,000) skews the average WAY up. Conversely, the average income would be skewed WAY down if someone had an income of $500. The median income for the same data set is $50,000. Outlier data doesn’t skew the median.
Most Business Owners Should Use Median Income
So most business owners should use the median income as a true indicator of wealth, because it provides a more accurate representation of a typical income, especially in areas with significant income disparity.
When Should You Use Average Income
If your target market is high-income households, the average income may be more relevant. This is because the average income can highlight the presence of a higher concentration of wealthy individuals, which is beneficial for luxury goods and services marketing. We’re using average income on this page because using the Census’s highest reported median value of $250,001 could result in multiple ties for the richest geography.
Why do so many cities have a median value of $250,001?
The Census' American Community Survey uses $250,000+ as a jam value for median income estimates to protect privacy, ensure data consistency, and simplify reporting. A "jam value" in survey data refers to a placeholder or default value used when actual data points are unavailable, incomplete, or exceed certain thresholds. We represent this jam value as $250,001 to make it easy for you to sort.
You might also be interested in:
Email Me When New Data Are Released
Join thousands of subscribers and receive just 1 (ONE!) email a year in December when the US Census Bureau releases new income data for Massachusetts richest cities.
SOURCES
United States Census Bureau. Annual Estimates of the Resident Population: April 1, 2020 to July 1, 2023. U.S. Census Bureau, Population Division. Web. May 2024. http://www.census.gov/.
United States Census Bureau. B01001 SEX BY AGE, 2024 American Community Survey 5-Year Estimates. U.S. Census Bureau, American Community Survey Office. Web. 29 January 2026. http://www.census.gov/.
United States Census Bureau. B19013 Median Household Income, 2024 American Community Survey 5-Year Estimates. U.S. Census Bureau, American Community Survey Office. Web. 29 January 2026. http://www.census.gov/.
United States Census Bureau. "DP03 SELECTED ECONOMIC CHARACTERISTICS." 2024 American Community Survey 5-Year Estimates. U.S. Census Bureau, American Community Survey Office. Web. 29 January 2026. http://www.census.gov/.
Products & Services
Plumbing
Connect
- 1-800-939-2130
- Contact Us
© Copyright 2026 Cubit Planning, Inc.