Richest Counties in Massachusetts (2026)
by Kristen Carney
Updated: February 9, 2026
Richest County in Massachusetts
The richest county in Massachusetts is Nantucket County with an average household income of $205,560 as of 2024 and 14,483 people as of 2024 according to the most current Census data available (citation).
| Rank | County | Population | Average Income | Median Income |
|---|---|---|---|---|
| 1 | Nantucket County | 14,483 | $205,560 | $139,688 |
| 2 | Dukes County | 20,933 | $205,357 | $125,786 |
| 3 | Norfolk County | 730,082 | $183,022 | $130,739 |
| 4 | Middlesex County | 1,638,365 | $178,070 | $130,847 |
| 5 | Plymouth County | 535,075 | $151,136 | $114,201 |
| 6 | Essex County | 813,054 | $140,098 | $101,883 |
| 7 | Suffolk County | 785,121 | $139,201 | $95,631 |
| 8 | Barnstable County | 231,668 | $134,349 | $95,241 |
| 9 | Worcester County | 867,788 | $124,653 | $95,939 |
| 10 | Hampshire County | 162,028 | $117,323 | $87,001 |
| 11 | Bristol County | 582,270 | $111,532 | $85,625 |
| 12 | Berkshire County | 129,430 | $108,456 | $76,013 |
| 13 | Hampden County | 462,815 | $94,811 | $71,306 |
| 14 | Franklin County | 70,944 | $94,042 | $74,907 |
Median Income versus Average Income: Which Should You Use?
We usually suggest using median income data – either instead of or in addition to – average income data as a true indicator of wealth. If you haven’t thought about median versus average since your last standardized test, you aren’t alone. Here’s what they are:
- average is the sum of a set of numbers divided by the count of numbers in the set
- median is the middle number in the set of numbers
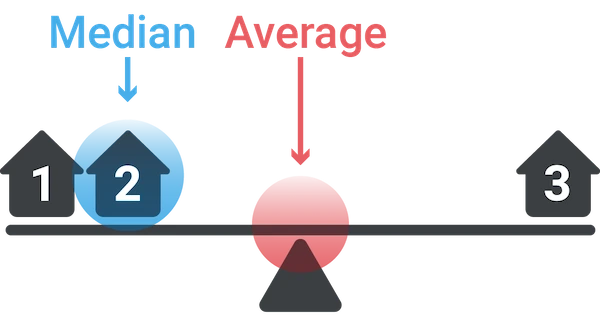
Now let’s say you had the following simplified set of income data.
Household 1: $30,000
Household 2: $50,000
Household 3: $1,000,000
The average income for this set is $360,000. The outlier data point ($1,000,000) skews the average WAY up. Conversely, the average income would be skewed WAY down if someone had an income of $500. The median income for the same data set is $50,000. Outlier data doesn’t skew the median.
Most Business Owners Should Use Median Income
So most business owners should use the median income as a true indicator of wealth, because it provides a more accurate representation of a typical income, especially in areas with significant income disparity.
When Should You Use Average Income
If your target market is high-income households, the average income may be more relevant. This is because the average income can highlight the presence of a higher concentration of wealthy individuals, which is beneficial for luxury goods and services marketing. We’re using average income on this page because using the Census’s highest reported median value of $250,001 could result in multiple ties for the richest geography.
Why do so many cities have a median value of $250,001?
The Census' American Community Survey uses $250,000+ as a jam value for median income estimates to protect privacy, ensure data consistency, and simplify reporting. A "jam value" in survey data refers to a placeholder or default value used when actual data points are unavailable, incomplete, or exceed certain thresholds. We represent this jam value as $250,001 to make it easy for you to sort.
You might also be interested in:
Email Me When New Data Are Released
Join thousands of subscribers and receive just 1 (ONE!) email a year in December when the US Census Bureau releases new income data for Massachusetts richest counties.
SOURCES
United States Census Bureau. Annual Estimates of the Resident Population: April 1, 2020 to July 1, 2024. U.S. Census Bureau, Population Division. Web. May 2025. http://www.census.gov/.
United States Census Bureau. B01001 SEX BY AGE, 2024 American Community Survey 5-Year Estimates. U.S. Census Bureau, American Community Survey Office. Web. 29 January 2026. http://www.census.gov/.
United States Census Bureau. B19013 Median Household Income, 2024 American Community Survey 5-Year Estimates. U.S. Census Bureau, American Community Survey Office. Web. 29 January 2026. http://www.census.gov/.
United States Census Bureau. “DP03 SELECTED ECONOMIC CHARACTERISTICS.” 2024 American Community Survey 5-Year Estimates. U.S. Census Bureau, American Community Survey Office. Web. 29 January 2026. http://www.census.gov/.
Products & Services
Plumbing
Connect
- 1-800-939-2130
- Contact Us
© Copyright 2026 Cubit Planning, Inc.